Fancy some IoT stuff???
I just made a temperature monitoring over the internet using a suite of Open Source software and hardware over the last few days. What triggered me was the youtube video on sensormonkey on hooking up a sensor and published the sensor data live over the Internet. The most intriguing part was, it comes with Public and Private key pair for use with public and private sensors. The video demo for the potentiometer was done using local, i.e 127.0.0.1 and later videos were on the owner’s Internet server. There is a possible gap that needs to be address, which is publishing sensor data over publicly available and FREE web publishing services. Particularly in this example of mine, publishing the temperature sensor data over my blog.
The reason for me to do so? Usually I am at a dilemma of coming to office to work over the weekends. The central air-cond that powered the whole block of T15 (7 floors, each floor with 6 tutorial rooms, each room with 3 aircond unit) will not be turned on for MY CONSUMPTION. Working in a stuffy, HOT & HUMID office can be counterproductive, with my small little pathetic fan puff helplessly to cool down. Nonetheless, work still need to be done. Sometimes, there are events that are running here and I will get to enjoy the cool working environment and achieve UBER PRODUCTIVITY. But it is a hit and miss situation. Having this Open Source Temperature Monitoring of my Office over the Internet, I can make a well informed choice on where to work.
The flow of connection will be as below.
LM35->Arduino ->computer->bloom->sensormonkey->processing.js->blogspot
Stuffs that you might need to do this experiment
- Arduino www.arduino.cc , and a LM35 temperature sensor connected to A0. It is the hardware that acquire real world data and digitizing it for Internet consumption.
- Bloom http://sensormonkey.eeng.nuim.ie/index.php/site/page?view=support.bloom bridge the gap between serial data and TCP/IP data.
- Sensormonkey http://sensormonkey.eeng.nuim.ie (thanks for the awesome introduction and tutorial) provides the platform to publish data on the Internet
- Processing.js , sister of processing; provides the visualization of the sensor data
- Blogspot.com , web blog
Can't wait? jump to HERE http://
The whole procedure start by programming the LM35 on Arduino, Configuring bloom, setting up sensormonkey, programming the javascript and pde and finally host it on a blog. One point to note, to ensure data is continuously stream over the Internet, remain signed-in on sensormonkey, do not close the sensormonkey page, do not stop bloom, do not disconnect arduino from computer and finally, do not turn off the computer. PHEWWWW……
Sounds Complicated to IoT your sensor data on a blog??!!!? LOLx
It took me a few days, but I only get to work on it after office hours for maybe 1-2 hours each day. It ranges from figuring “how-it-works” to installation, troubleshooting and finally deployment. Be sure to check out the comments in the source code for the explanation.

Check out the code on snipt.net
Check out the configuration, taking special notice to parameters marked with a red tick.
3. Login to sensormonkey website with your Facebook account.
Click on sensors, follow by launch sensormonkey control panel and you will be greeted by the screen below.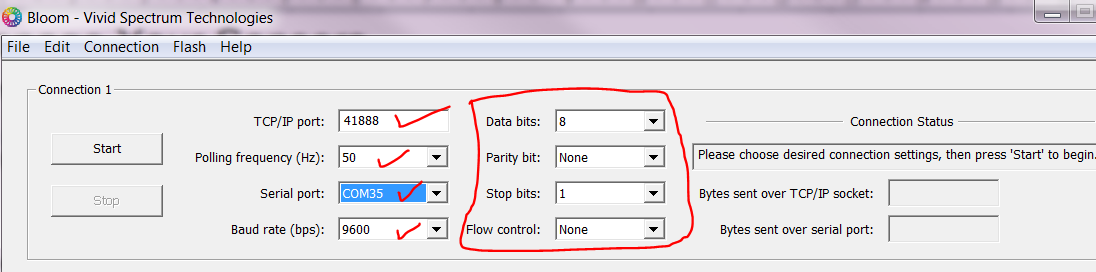
Configure your ports (TCP/IP and serial) accordingly. My arduino resides at COM35, yours might be different. Use 9600-8-N-1, failing to match the parameters both side will result in data corruption. So, if you would like to use 115200 instead, remember to change accordingly in code for arduino and also bloom. Next, enter the name for the sensor. I find this naming too ambiguous. It should be the name of the board/device instead of sensor. I made a mistake of naming all of the variables officeLM35 and had a problem at a later stage programming the *.js and *.pde. After naming the sensor, the following screen appear
Configure the sensor. On arduino, the code is Big Endian, 16bit and MSB is always transmitted first. The variable name “officeLM35BigEndian16Bit” does matter, because it will be used in the *.js. The variable name was changed to something meaningful at the later part.
The final configuration for my office temprature sensor as seen here http://shin-ajaran.blogspot.sg/2012/07/drive-webpage-on-blogspot-in-real-time.html
Sensor name @ local sensor: myOffice
add sensor: officeLM35
sensor configured to use js graph: myLM35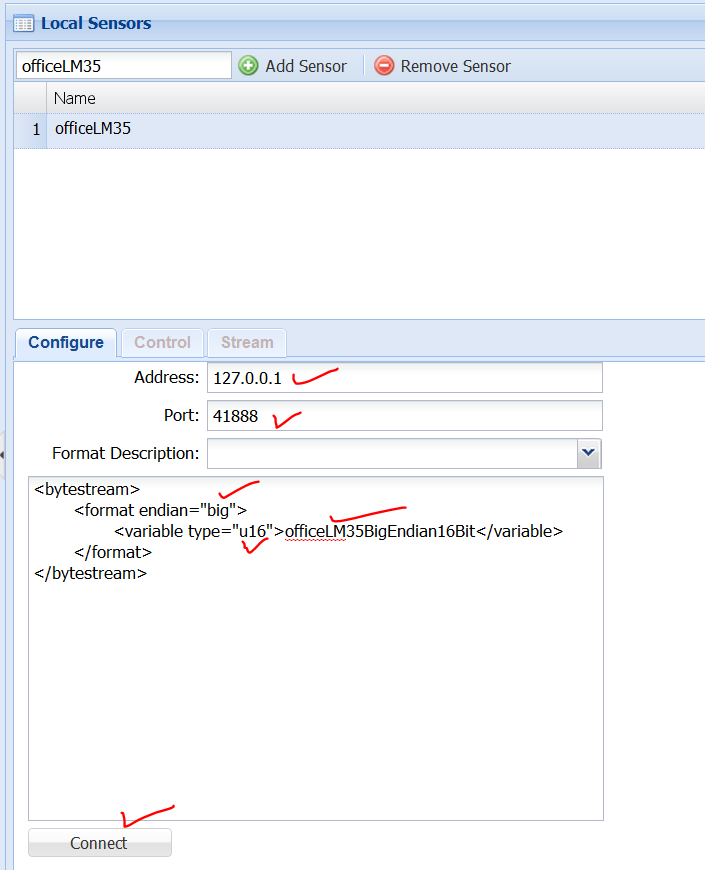
Click on connect.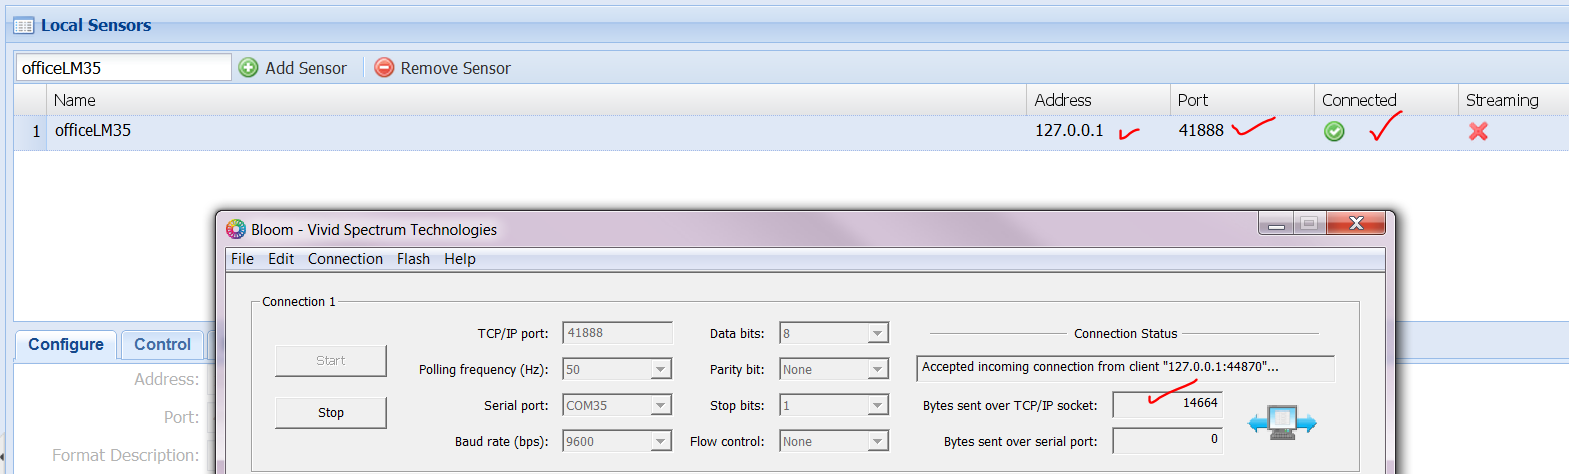
Click on the icon circle in red to observe the data. I took the liberty of modifying the colours, just for experimenting.
To publish the sensor on the Internet as a public, follow the following screen.
One the data is publish on the local sensor panel proceed to publish it for remote streaming
Click on the remote sensor and click subscribe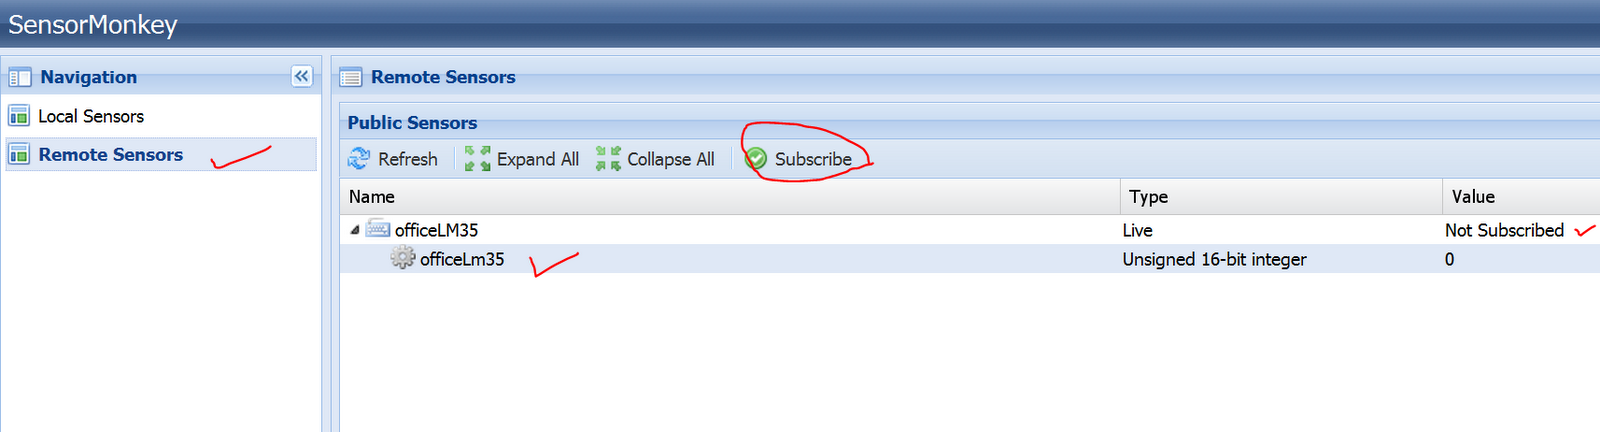
Once all the above are done, there are several things to take note of. Go to the sensormonkey website and locate your Public key, private key and namespace. These data will be used in conjunction of your streaming data.
4. Testing of data streaming with local HTML5 fileDownload processing.js and place in the same folder as the *.html file
Downlod processing and compile the file as Graph.pde and place in the same folder as the *.html file.
Check out the html5 code hosted on snipt. You are good to go.
HTML5 rox~!
in your html code, the path to the processing.js and Graph.pde is important, reflect accordingly. Another thing to add, this is indicated as method1 on the processing.org/learning
The weird part, the *.html opens in firefox, but not chrome nor IE.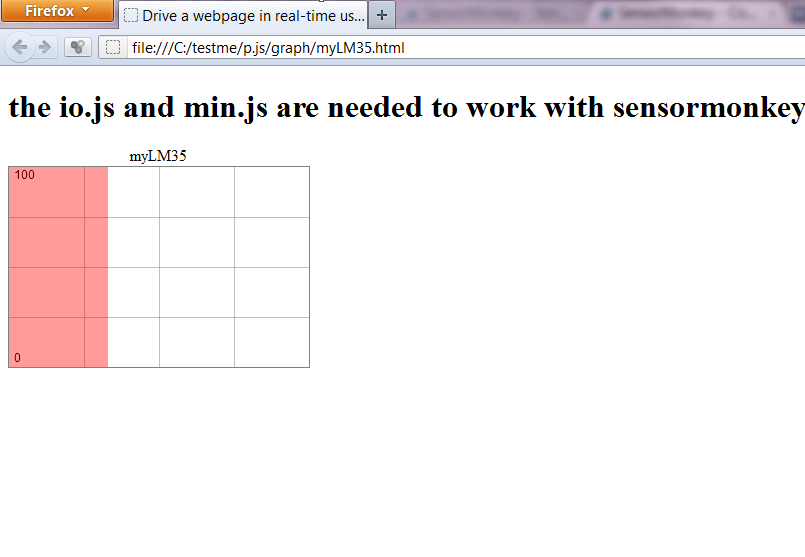
If you notice that, the streaming data is always 100 (for degC). The problem lies with the variable naming in sensormonkey , *.js and *.html
When the page is closed, a pop-up box will appear.
After troubleshooting the code…. Inferring is very important in troubleshooting software / code related issues.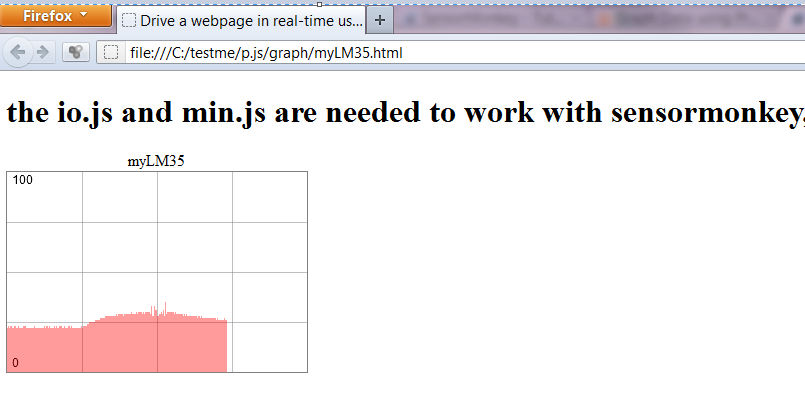
SWEEET~!
Check out the final source code for the method2 implementation
5. Testing with blogspot.
After much tinkering with *.pde + *.js + *.html on blogspot, I came to the conclusion that method2 indicated on processing.org/learning is the workable solution. Heng arh!

Enjoy
Sounds Complicated to IoT your sensor data on a blog??!!!? LOLx
It took me a few days, but I only get to work on it after office hours for maybe 1-2 hours each day. It ranges from figuring “how-it-works” to installation, troubleshooting and finally deployment. Be sure to check out the comments in the source code for the explanation.
- Connecting LM35 to Arduino
Check out the code on snipt.net
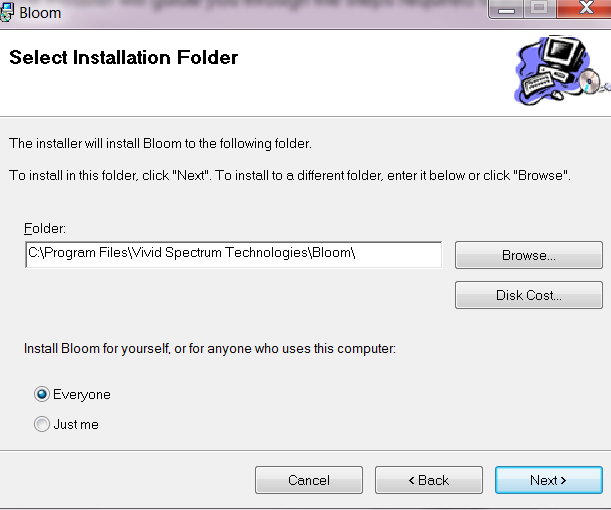
- Download and Install Bloom, URL from above.
Click next to continue
After installation, this icon will appear on your desktop.
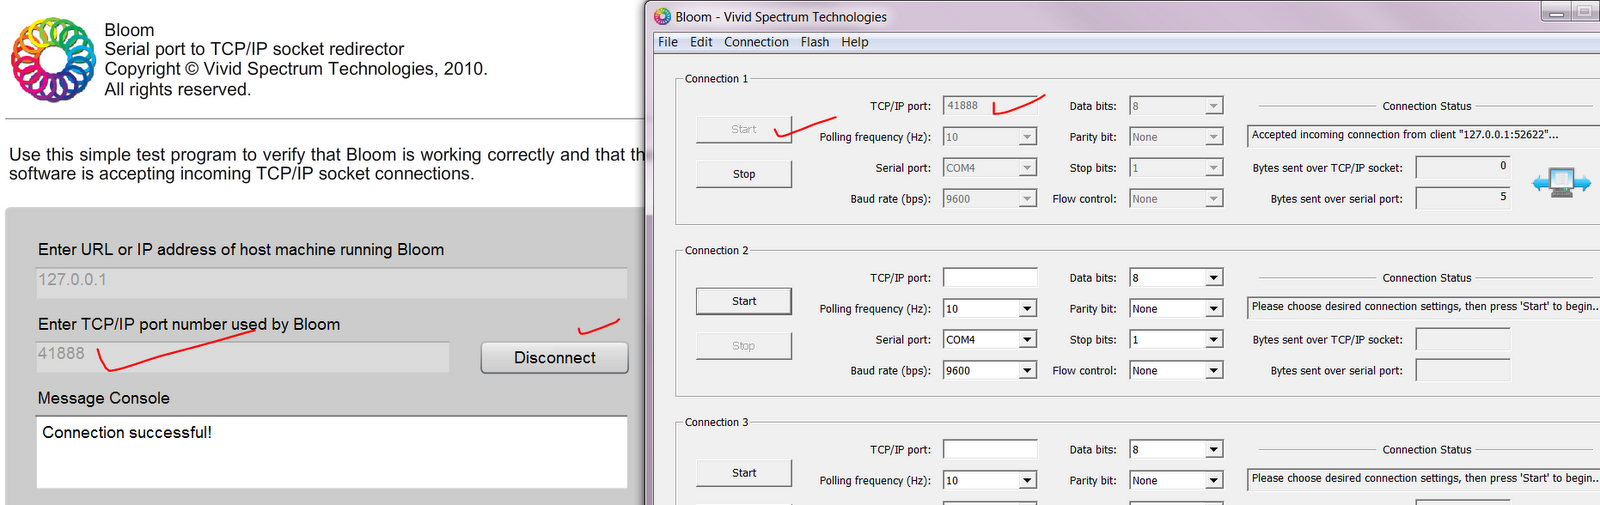
Do a preliminary test with bloom, make sure your serial device is connected. Mine is a dummy serial on com4 with port 41888. The port number, use one that is ephemeral range, which is 49152 to 65535, recommended by IANA. But, I like the number 41888 very much. LOL. Do not use the range <1024, it might conflict with existing application with networking capabilities.


Check out the configuration, taking special notice to parameters marked with a red tick.
3. Login to sensormonkey website with your Facebook account.
Click on sensors, follow by launch sensormonkey control panel and you will be greeted by the screen below.
Configure your ports (TCP/IP and serial) accordingly. My arduino resides at COM35, yours might be different. Use 9600-8-N-1, failing to match the parameters both side will result in data corruption. So, if you would like to use 115200 instead, remember to change accordingly in code for arduino and also bloom.
Next, enter the name for the sensor. I find this naming too ambiguous. It should be the name of the board/device instead of sensor. I made a mistake of naming all of the variables officeLM35 and had a problem at a later stage programming the *.js and *.pde. After naming the sensor, the following screen appear Configure the sensor. On arduino, the code is Big Endian, 16bit and MSB is always transmitted first. The variable name “officeLM35BigEndian16Bit” does matter, because it will be used in the *.js. The variable name was changed to something meaningful at the later part.
The final configuration for my office temprature sensor as seen here http://shin-ajaran.blogspot.sg/2012/07/drive-webpage-on-blogspot-in-real-time.html
Sensor name @ local sensor: myOffice
add sensor: officeLM35
sensor configured to use js graph: myLM35
Click on connect.
Click on the icon circle in red to observe the data. I took the liberty of modifying the colours, just for experimenting.
To publish the sensor on the Internet as a public, follow the following screen.
One the data is publish on the local sensor panel proceed to publish it for remote streaming
Click on the remote sensor and click subscribe
Once all the above are done, there are several things to take note of. Go to the sensormonkey website and locate your Public key, private key and namespace. These data will be used in conjunction of your streaming data.
4. Testing of data streaming with local HTML5 fileDownload processing.js and place in the same folder as the *.html file
Downlod processing and compile the file as Graph.pde and place in the same folder as the *.html file.
Check out the html5 code hosted on snipt. You are good to go.
HTML5 rox~!
in your html code, the path to the processing.js and Graph.pde is important, reflect accordingly. Another thing to add, this is indicated as method1 on the processing.org/learning
The weird part, the *.html opens in firefox, but not chrome nor IE.
If you notice that, the streaming data is always 100 (for degC). The problem lies with the variable naming in sensormonkey , *.js and *.html
When the page is closed, a pop-up box will appear.
After troubleshooting the code…. Inferring is very important in troubleshooting software / code related issues.
SWEEET~!
Check out the final source code for the method2 implementation
5. Testing with blogspot.
After much tinkering with *.pde + *.js + *.html on blogspot, I came to the conclusion that method2 indicated on processing.org/learning is the workable solution. Heng arh!
Enjoy

3 comments:
Hi, nice job, I've done similar thing with different tools: http://qubol.blogspot.ie/2012/08/diy-meteo-station-pt2.html
Thats neat. Really cool.
what about sensor monkey they had stop servicing ...if any other site is their let me know about it.
Post a Comment